

Internet advertising is the business model that keeps on giving. Since its birth in the mid-nineties, it has mushroomed, generating more than $230 billion in revenues globally last year based on ARK estimates. After such a phenomenal run, many analysts expect a slowdown, with advertising research firm Zenith projecting 11% growth and eMarketer 15% in 2019. If they are right, the internet advertising gravy train will slow to a crawl, hitting industry giants like Google [GOOG] and Facebook [FB] with a sharp deceleration in revenue growth. As illustrated in this piece, however, internet advertising could continue to grow at a 15-20% rate for many years to come, capturing 50% of advertising budgets in two years and hitting the size of the entire advertising market today several years later.
Both industry and financial analysts have underestimated the potential of internet advertising for years. In 2014, eMarketer estimated that its growth would slow from 20% in 2012 to 10% in 2017, reaching $188 billion, as shown below. In reality, revenue hit $232 billion by its own estimate, exiting at a 21% growth rate.

Financial analysts have not fared much better. Shortly after Facebook’s IPO in 2012, Bernstein analyst Carlos Kirjner wrote that in the most optimistic scenario—Facebook could grow revenues to $20 billion by 2017. In reality, Facebook’s ad business reached $40 billion last year.
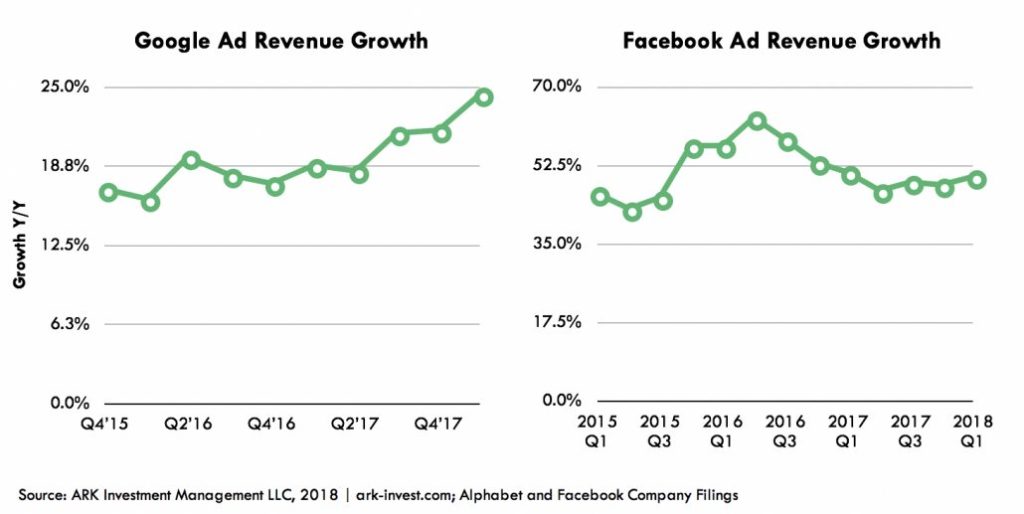
The reason why actual results surpassed analyst projections is simple—the forecasts assumed that as internet advertising matured, growth rates would slow, as depicted in the red line in the charts above. In reality, internet advertising has done the opposite—rather than slowing, the growth rates of Google and Facebook, who jointly control the majority of ad dollars, has accelerated, as shown below. In fact, the phenomenon of sustained, high rate growth with minimal decay is the primary reason why internet stocks have performed so well over the past decade. We see it not just in advertising, but in travel (Priceline [BKNG]), e-commerce (Amazon [AMZN]), and entertainment (Netflix [NFLX]).
So, during the next five years, will the strong growth in internet advertising continue or moderate? Once again, the consensus view is for a deceleration year after year. eMarketer’s 2017–2022 projection, for example, mirrors its forecast from 2014, as shown above, and now that the internet penetration has crossed 50% globally, the law of large numbers could come into play.
But, what if internet advertising doesn’t slow down? After all, 50% is only the middle of the s-curve and, arguably, video is about to hit an inflection point. YouTube recently crossed 1 billion hours viewed per day. Facebook, Instagram, Twitch, Twitter [TWTR], and Snap [SNAP] all are ramping video content and, therefore, video ad inventory. While digital direct response advertising took share from print in the first leg of internet, digital video advertising could take share from TV in the second leg.
What would be the impact on budgets of sustained strong growth in internet advertising? If you assume compounded growth rates of 15% for Google, 20% for Facebook, 20% for China, and 12% for everyone else, internet advertising would reach $620 billion by 2023—a figure that’s larger than the entire global advertising market today.
One might say that that is sufficient proof that internet advertising must slow down lest it exceeds its total addressable market. But it’s just as dangerous to assume that the size of advertising market is a static number or a fixed percent of global GDP.
As a percent of GDP, global advertising has ebbed and flowed over the past 90-95 years, and today is near an all-time low. In the US, the ratio is at the low end of its 1.0-1.5% historical range, and globally at 0.4%, it has hit its lowest point since at least 2000. It stands to reason that there’s room for expansion in ad spend relative to GDP, especially if that spend can justify itself in terms of return-on-investment, which is internet advertising’s core strength.

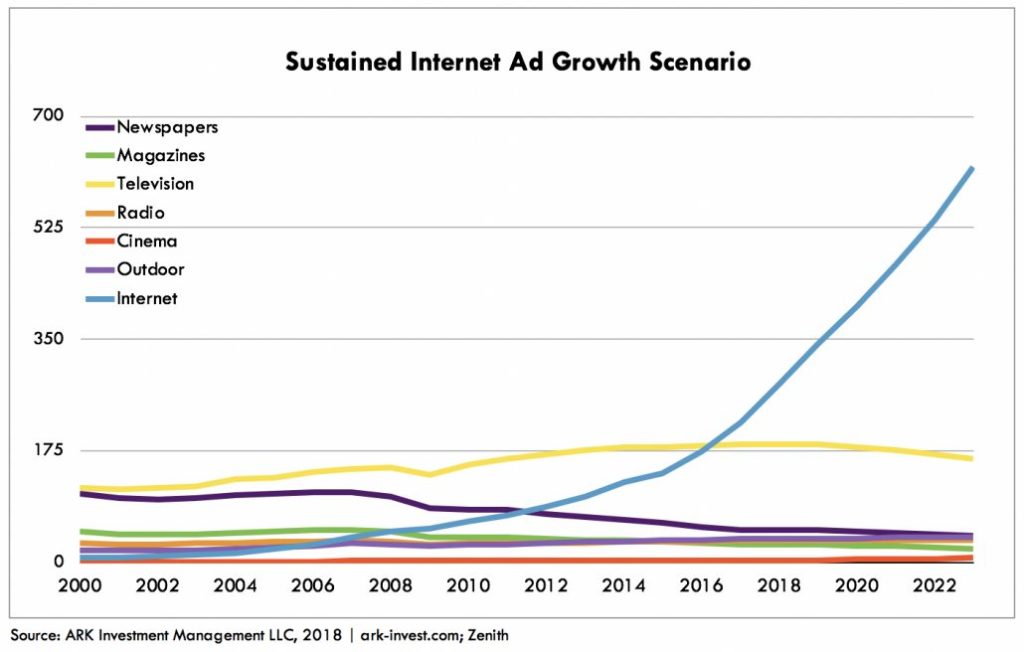
If internet advertising continues to grow, it would dwarf all other formats, as shown below. While the chart looks incredible, its assumptions are not. It assumes market leaders Google and Facebook will grow at 15-20% compound annual rates, probably too conservative an estimate as both have significant available ad inventory and spending surveys continue to favor their platforms. Moreover, contrary to popular belief, their growth has not been at the expense of other digital publishers. According to their financial reports, Twitter, Snapchat, Spotify [SPOT], Zillow [ZG], Vox, New York Times [NYT], Meredith Media [MDP], and Amazon all are experiencing strong double-digit growth in digital advertising which we assume will slow to 12% annual growth on average.
Amazon in particular has potential to contribute out-sized growth. Already roughly half of US consumers start their product search on Amazon, bypassing Google’s most important search ads. These shoppers see Amazon’s sponsored product ads which are highly valuable and result in direct measurement of sales. Amazon’s $3 billion ad business is growing quickly and could dampen Google’s search business in the coming years.
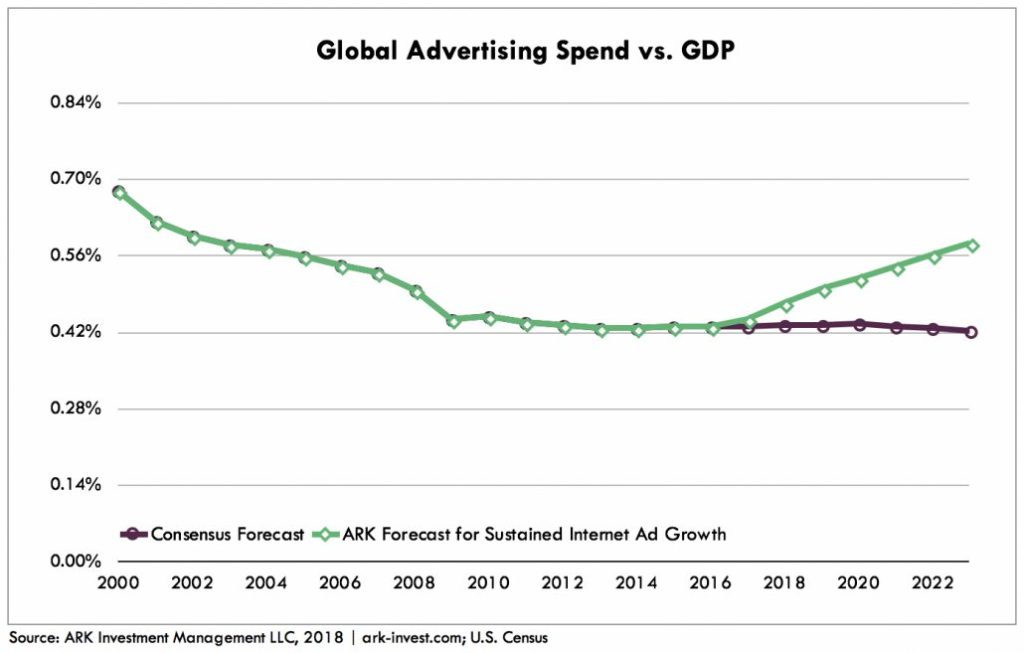
As a reality check, we plotted our sustained growth scenario as a percent of global GDP, assuming GDP growth of 4% per year, as shown below. After nearly two decades of declining and stagnating, our forecast is for a solid inflection as opposed to “more of the same” from the consensus point of view. Worth noting, our projection does not require an unprecedented change in attitudes, merely a return in advertising relative to GDP to a level last observed in 2002.
Analysts and investors have historically underestimated the size of the internet advertising market and continue to do so based on a static set of assumptions. Yet, more than any other medium, internet advertising has evolved and re-invented itself constantly. The drivers of growth today – mobile, video, and programmatic – barely existed ten years ago. There’s no telling what the next ten years might bring.
On balance, we believe sustained growth is more likely than maturation. Five years from now the ad market as a whole could top $900 billion, two thirds accruing to the internet, not because of a fundamental change in attitudes, just more eyeballs and better ads…which is the goal of every internet company every day.
Related Research